Back to the Futu-rr-e: Deterministic Debugging with rr
What follows is an embloggified version of an introduction to the rr
debugger that I gave at a local Linux Users Group meet up on October 6th, 2015.
Hello, everyone! My name is Nick Fitzgerald and I'm here to talk about a
(relatively) new kid on the block: the rr debugger. rr is built by some
super folks working at Mozilla, and I work at Mozilla too, but not with them and
I haven't contributed to rr (yet!) — I'm just a very happy customer!
At Mozilla, I am a member of the Firefox Developer Tools team. I've done a good amount of thinking about bugs, where they come from, the process of debugging, and the tools we use in the process. I like to think that I am a fairly savvy toolsmith.
These days, I'm doing less of building the devtools directly and more of baking APIs into Gecko (Firefox's browser engine) and SpiderMonkey (Firefox's JavaScript engine) that sit underneath and support the devtools. That means I'm writing a lot of C++.
And rr has quickly become the number one tool I reach for when debugging
complicated C++ code. rr only runs on Linux and I don't even use Linux as my
day-to-day operating system! But rr provides such a great debugging
experience, and gives me such a huge productivity boost, that I will reboot
into Fedora just to use rr for all but the most trivial bugs. Take note of
that, Linux advocates.
But before we dive into rr and why it is so awesome, I'd like to step back and
talk a bit about the anatomy of a bug and the process of debugging.
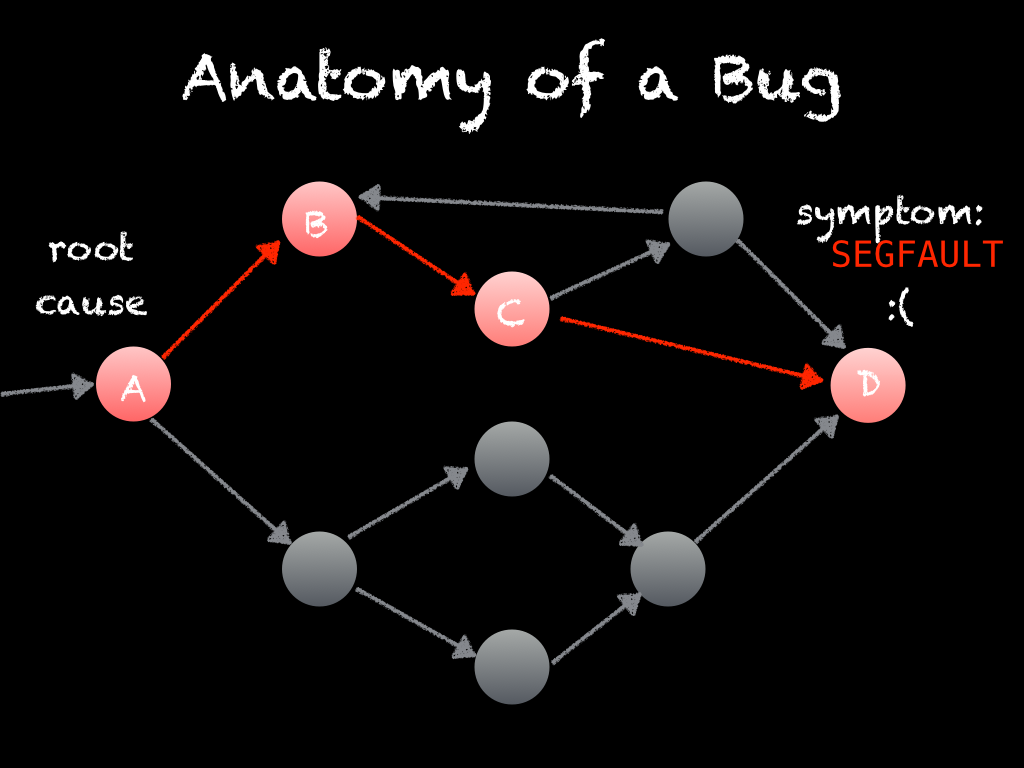
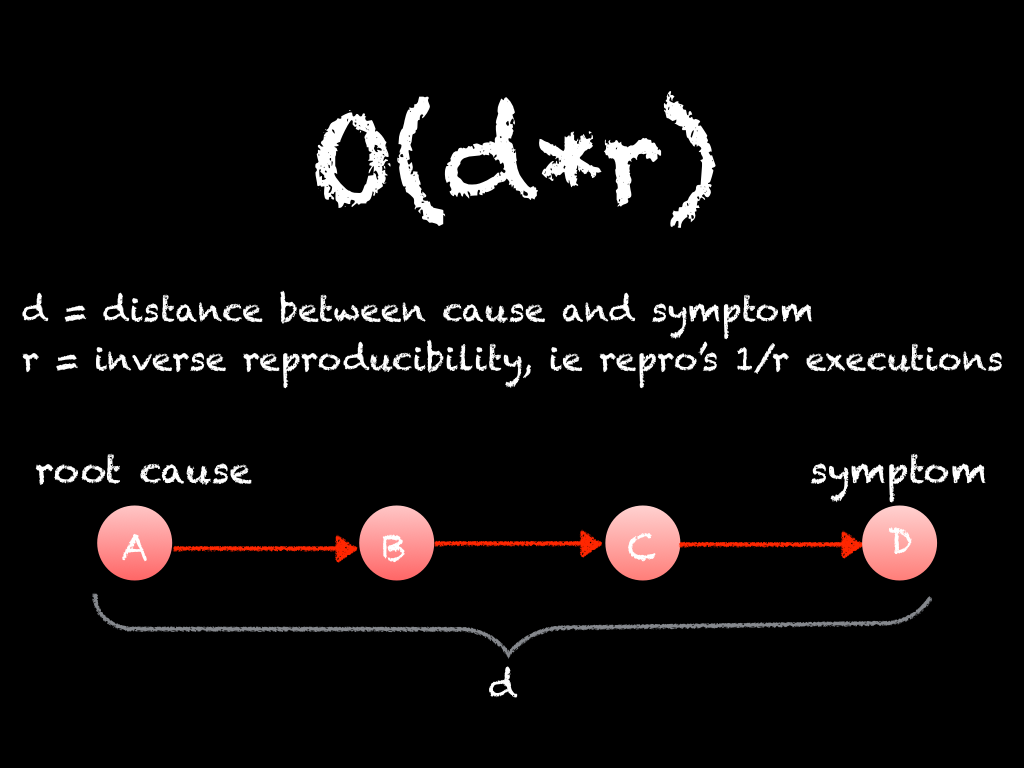
A bug has a symptom, for example the program crashes or something that was supposed to happen didn't, and it has an origin where things first started going wrong or misbehaving. Between the origin and the symptom is a cause and effect chain. The cause and effect chain begins with the bug's origin and ends with the symptom you've observed.
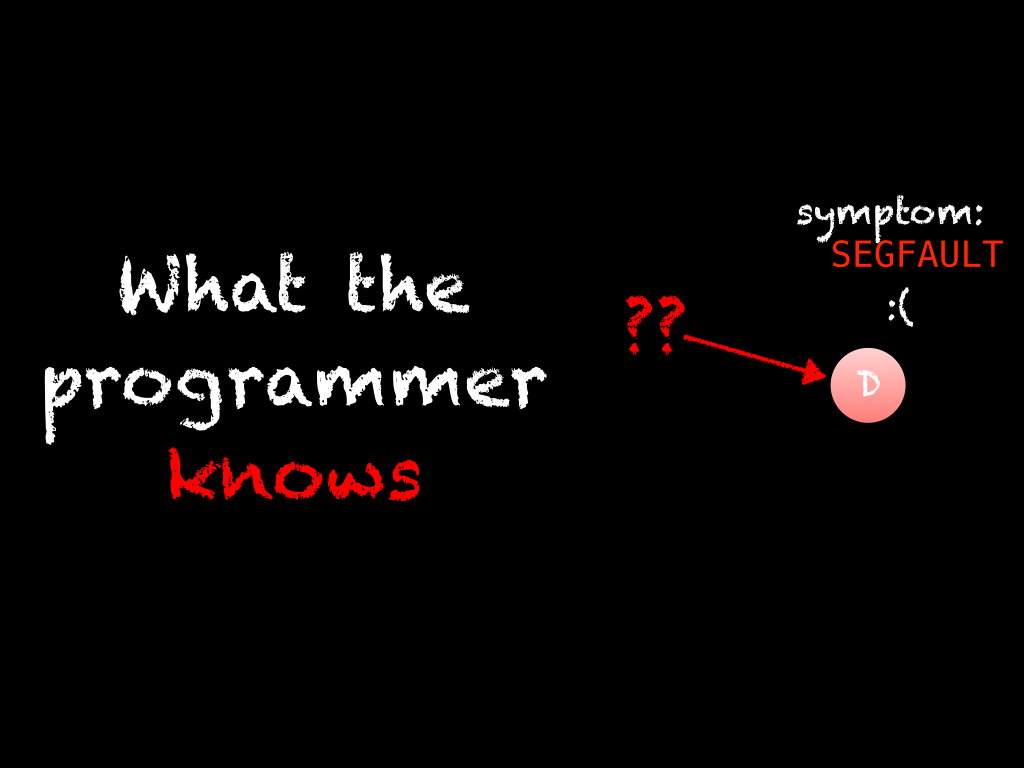
Initially, the cause and effect chain and the origin are hidden from us. When first investigating a bug, we only know its final symptoms.
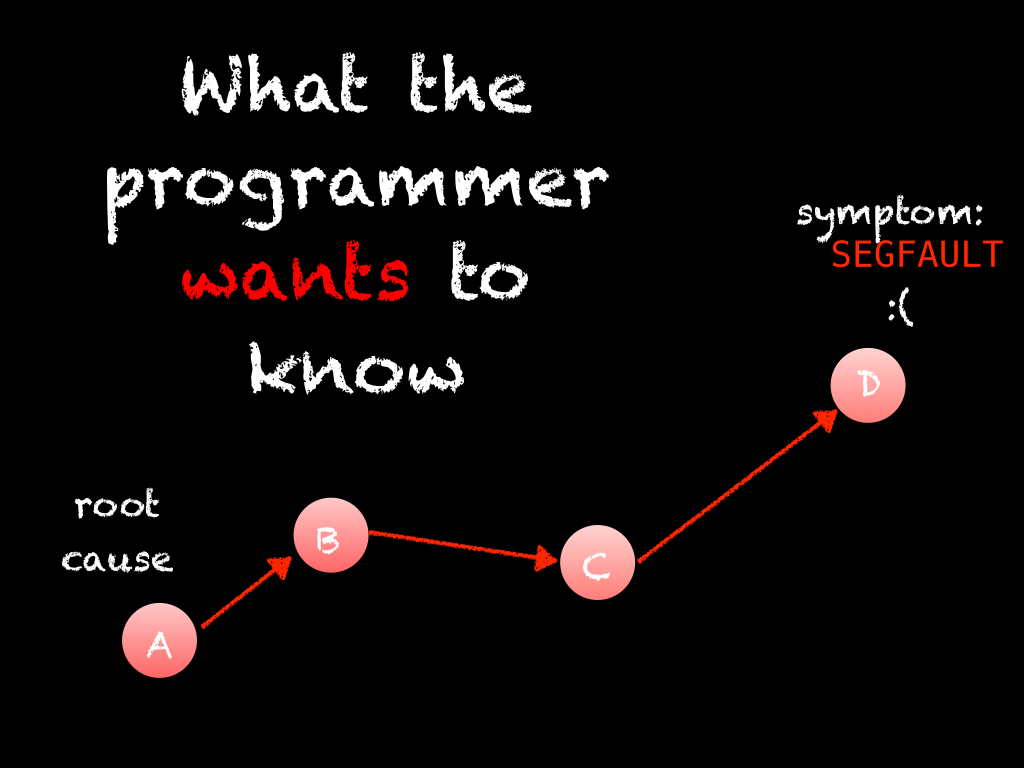
But what we really want to know is the root cause or origin of the bug, because that is where we need to apply a fix and resolve the bug. To get there, we have to reason backwards through the cause and effect chain. The process of debugging is the process of reasoning backwards through the cause and effect chain from the bug's symptom to its origin.
It follows that all debugging is "reverse debugging", but not all debuggers support reverse execution. And even among those debuggers that do support reverse execution, going backwards and forwards repeatedly can give you different results due to nondeterminism in the program.
Let's take a look at the ergonomics of walking backwards through the cause and effect chain in a traditional stepping debugger without reverse execution.
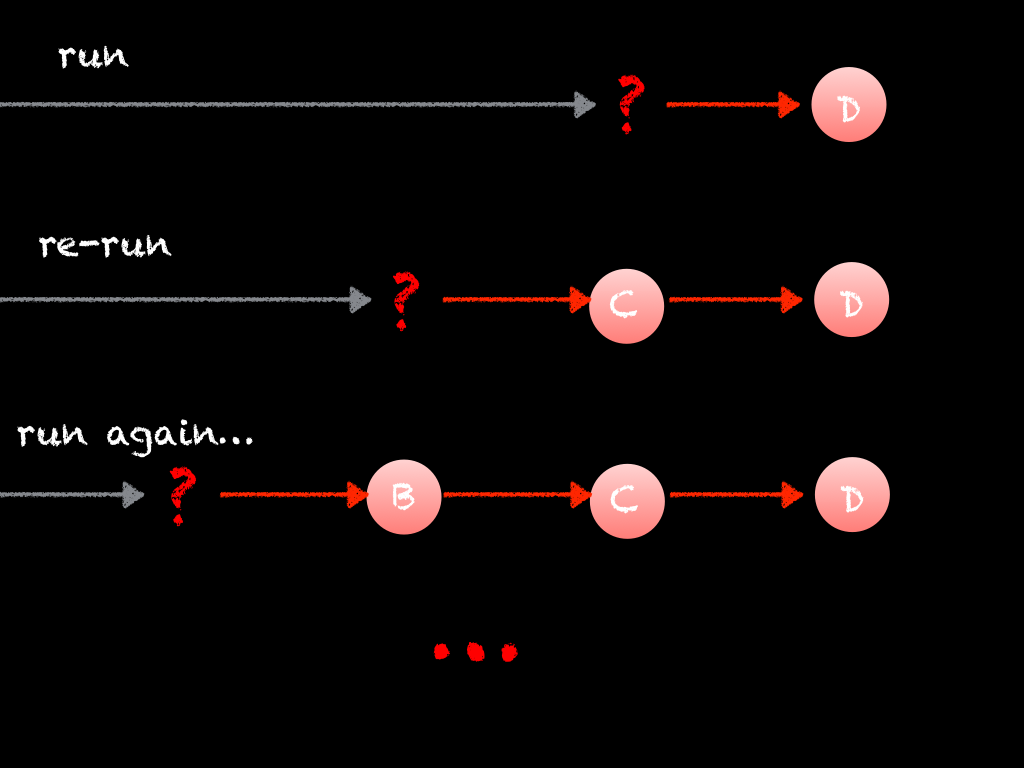
With a traditional debugger, we are slowly reasoning our way backwards, while the program executes forwards and we end up in a loop that looks something like this:
Pause or break at the point in the program's execution where things start to go wrong. "The program is crashing at D, let's pause at that point."
Poke around, inspect variables, frames on the stack, etc. and discover the immediate cause of the effect you have observed. "Oh, I see: D is being passed a null pointer because of C!"
But we get to the point where in order to find the next immediate cause, we need to either go backwards in time or restart the program's execution. Since the former is not an option in traditional debuggers, we are forced to restart the program. "But what conditions led to C giving out a null pointer? I'll set this breakpoint and restart the program."
Re-execute the program until you hit the breakpoint. Hopefully there aren't many false positives; conditional breakpoints can help cut down on them.
Loop back to (2) until we've found the origin of the bug.
I really hope we can reliably and consistently reproduce this bug, or else (4) will involve re-running the program many times! If the cause and effect chain is long, that means we are re-running the program many, many, many times! This productivity drain is compounded by false positives and manual, non-automatable steps-to-reproducing the bug. Not a good look.
If we shoehorn the debugging process afforded by a traditional debugger into big-O notation, we get O(d∙r) where d is the length of the cause and effect chain, and r is the inverse reproducibility, meaning that we need to execute the program about r times to reproduce the bug once.
When both d and r are very small, discovering the bug's origin is trivial. We aren't interested in this class of bugs; a traditional debugger will already serve just fine. When d or r grow larger, we quickly spend more and more time debugging and our productivity slows to a crawl. When both d and r are large, bugs can feel (and in practice be) impossible to resolve. It can even be so impractical that it's not worth spending time on and makes more business sense to let the bug live on! It's a sad situation to be in.
These really difficult to diagnose and fix bugs are the type we are interested in. If we can better debug this class of bug, we increase our productivity and can even fix bugs that were impossible or impractical to fix before. This results in better, more reliable software that is delivered faster.
rr provides a fundamentally better debugging process than traditional
debuggers and lives up to the promise of making seemingly impossible to fix bugs
into simply difficult. It untangles reproducing a bug from investigating the
cause effect chain by splitting the debugging process into two phases: recording
a program's execution and then replaying and debugging that recording
deterministically.
Using rr is kind of like investigating a theft at a corner store. The store
has a CCTV system that is recording everything going on inside. If you want to
solve the store's security problem, you could hire someone to watch the CCTV
feed in real time 24 hours a day and try and spot a thief in action but that is
expensive, manual, and time consuming. Alternatively, you could save that time
and money spent on watching the live video feed and wait until you've captured a
thief on camera. At that point, you can watch that recording at your leisure and
rewind, replay, fast forward, and enhance to determine who the thief is, and how
to make that theft impossible in the future. rr is the same way: you keep
recording until you've captured an occurrence of your bug and then you go back
and replay the recording to determine the origin of why that bug happened.
Photo credits: https://flic.kr/p/mYvfNr and https://flic.kr/p/7zrdKz
With rr, the first phase is recording an execution of your program that
reproduces the bug in question. The recording must include everything needed to
replay the program execution exactly. The key observation that rr leverages is
that most of a program's execution is deterministic. Therefore, if you record
all of the nondeterministic parts, then the rest of the program (the
deterministic parts) will by definition always yield the same results. This also
turns out to have less recording overhead than alternative techniques.
Examples of nondeterminism that rr records:
- Signals sent to the program by the operating system:
SIGINT,SIGSEGV, … - Interactions with the file system:
read(fd, buf, size), … - System calls in general:
getrandom(buf, size, flags), … - Context switches between threads
For system calls, ptrace is used to wrap the call, note its occurrence and
return value in the recording, and let the call return.
Concurrency and parallelism is a little trickier. True parallelism with shared
memory can't be recorded efficiently with today's hardware. Instead, rr only
supports concurrency and all threads are pinned to a single core. rr counts
the number of instructions executed between preemptions so it can recreate them
exactly in the replay phase. Unfortunately, this means that very parallel
programs will run much slower under rr than they otherwise would.
Photo credit: https://flic.kr/p/7JH3T3
The second phase is replaying the recording. Mostly, this phase is just running
the program again and letting the deterministic majority of it recompute the
same things it originally did. That is what lets rr's overhead stay low when
replaying.
The nondeterministic parts of the program's execution are emulated from the
original execution's recording in a couple different ways. System calls are
intercepted and the corresponding value from the recording is returned instead
of continuing with the actual system call. To emulate the exact preemptions
between context switches between threads, rr implements its own scheduler and
uses hardware performance counters to interrupt after the desired number of
instructions (that were previously noted in the recording) have been
executed. rr's scheduler then handles the interrupt and switches
contexts. Replaying signals is handled similarly.
If you want more implementation details,
this slide deck is a great deep dive into rr's internals for potential contributors. It
is from April, 2014, so a little dated, but my understanding is that rr is
just more featureful and hasn't been fundamentally re-architected since then.
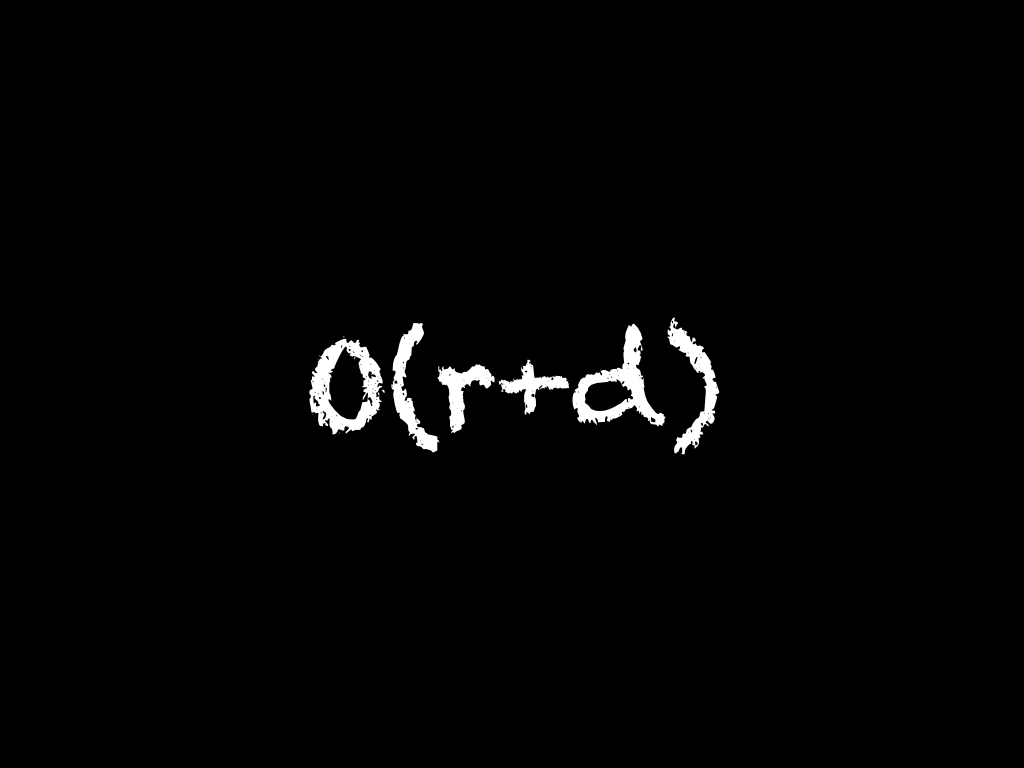
By splitting out reproducing a failure from investigating the cause and effect
chain, rr's debugging process is O(r+d). This is the time spent reproducing
the bug once while we are recording, plus the time spent deducing the cause and
effect chain. We don't need to continually reproduce the bug anymore! Only once
ever! This is a huge improvement over traditional debuggers, and if we can
automate recording the steps to reproduce until the bug occurs with a script,
then it is only O(d) of our personal time!
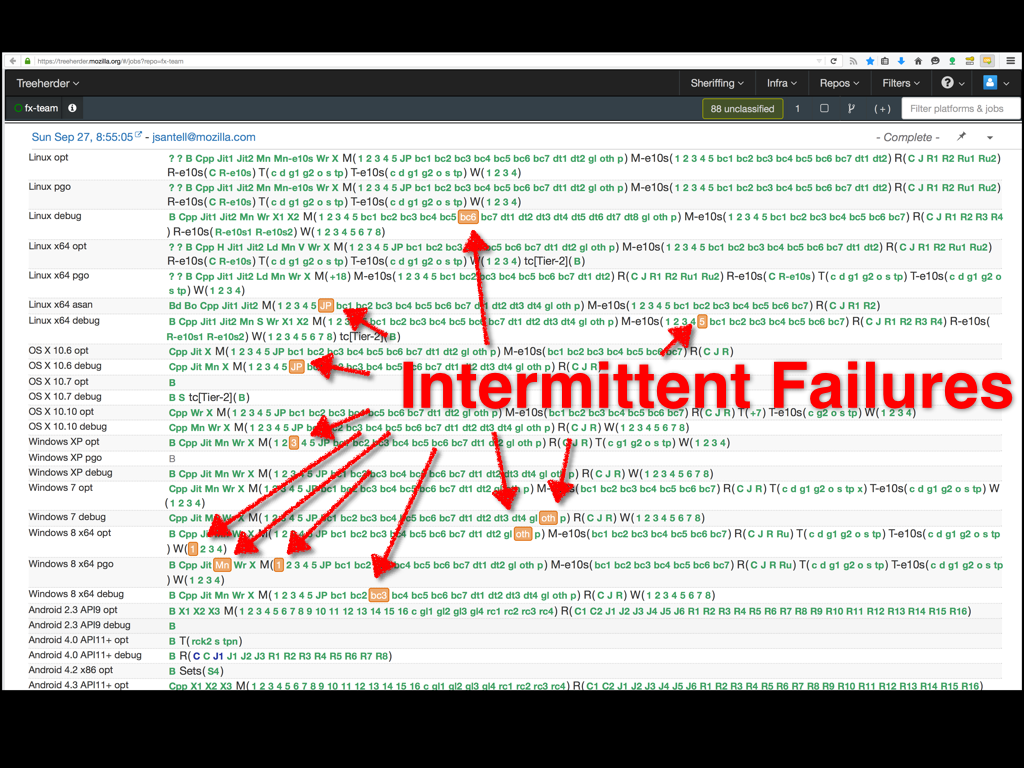
This is treeherder. All of Firefox, Gecko, and SpiderMonkey live inside the big mozilla-central repository. Everyday, there are hundreds of commits (from both paid Mozilla employees and volunteer contributors) landing on mozilla-central, one of its integration repositories (mozilla-inbound for platform changes and fx-team for frontend changes), or the Try testing repository. Every one of these commits gets tested with our continuous integration testing. Treeherder displays these test results. Green is a test suite that passed, orange means that one or more tests in that suite failed.
We have a lot of tests in mozilla-central. Some quick and dirty shell scripting yielded just under 30,000 test files and I'm sure that it wasn't exhaustive. Because we're all human, we write tests with bugs and they intermittently fail. If a test is failing consistently it is usually pretty easy to fix. But if a test only fails one out of a thousand times, it is very hard to debug. Still, it has a real impact: because of the sheer number of commits on and tests within mozilla-central, we still get many intermittent failures on every test run. These failures are a drag on developer time when developers have to check if it is a "real" failure or not, and while often they are poorly written tests that contain race conditions only in the test code, sometimes they will be real bugs that down the line are affecting real users.
rr puts these bugs that are seemingly impossible to debug within
reach. Mozilla infrastructure folks are investigating what is required to
optionally run these test suites under rr during our integration tests and
throw away the recording if an intermittent failure doesn't occur, but if it
does then save the recording for developers to debug at their leisure.
Wow! Hopefully you're convinced that rr is worth using. Most of the familiar
commands from gdb are still present since it uses gdb as a frontend. You
should definitely read the wiki page on
rr's usage. Here are a few tips
and tricks so you can hit the ground running.
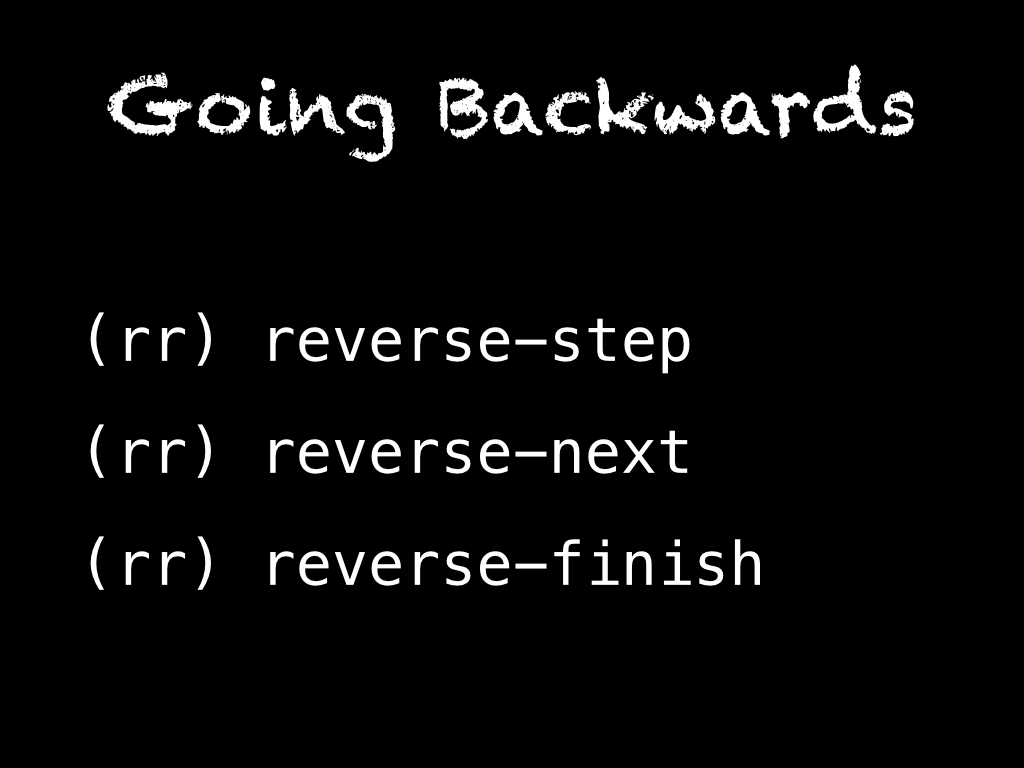
These are the same as the normal stepping commands but go backwards instead of forwards in the execution. Go backwards one instruction, expression, line, or even frame. What's really neat about this is that going backwards and forwards repeatedly is deterministic and you'll always get the same results.
Step backwards through the cause and effect chain directly, rather than piecing it back together with repeated forward execution!
Here is a real example I had a couple months ago where reverse stepping really
saved me a ton of time. I was implementing an extension to the structured
cloning algorithm to handle my SavedFrame stack objects so
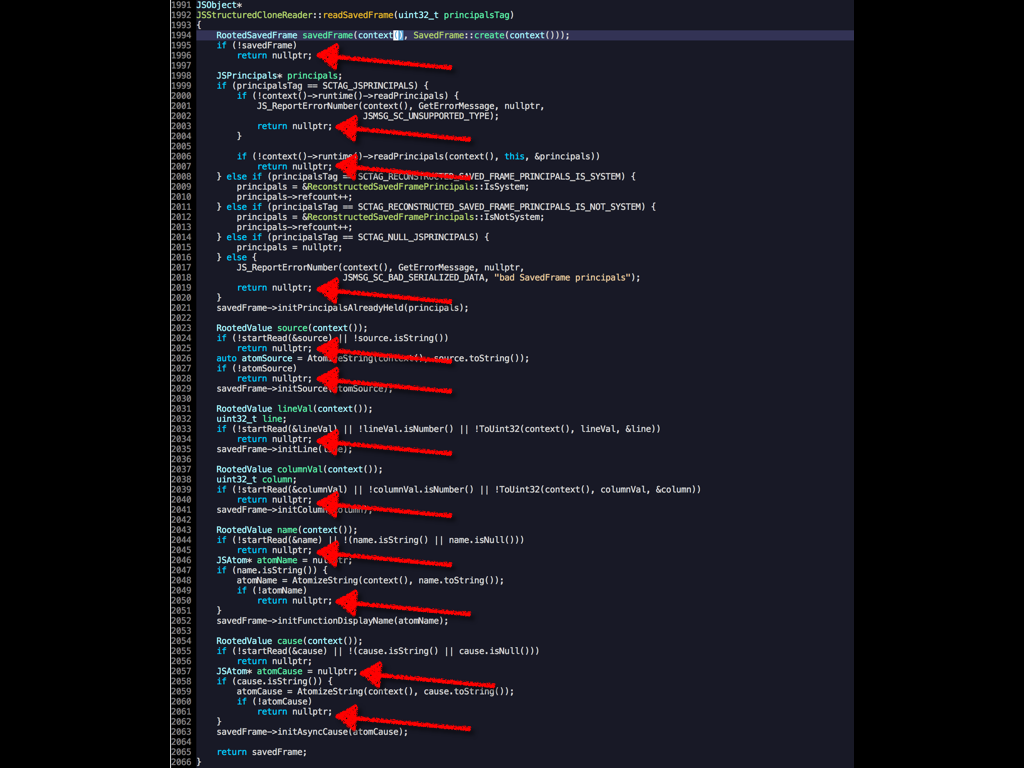
that they could be sent between WebWorkers. The function in question returns
nullptr on failure, and it does a lot of potentially fallible
operations. Twelve to be exact (see the lines highlighted with an arrow in the
screencap). I had a test that was failing. This function was called many times
and usually it would succeed, but one time it would fail and return nullptr
because one of its fallible operations was failing but I had no idea which one
or why. With a traditional debugger, my options were to set twelve breakpoints,
one on every return nullptr;, or break on every entry of the function (which
is called many times and usually succeeds) and then step through line by
line. Both options were tedious. With rr, I just set a conditional breakpoint
for when my call to the function returned nulltpr and then did a single
reverse-step command. I was taken directly to the failing operation, and from
there the origin of the bug quickly became apparent.
In the end, it turned out to be embarrassingly simple. I was doing this:
result = fallibleOperation();
if (result)
    return nullptr;
instead of this:
result = fallibleOperation();
if (!result)
    return nullptr;
Note the ! in the latter code snippet.
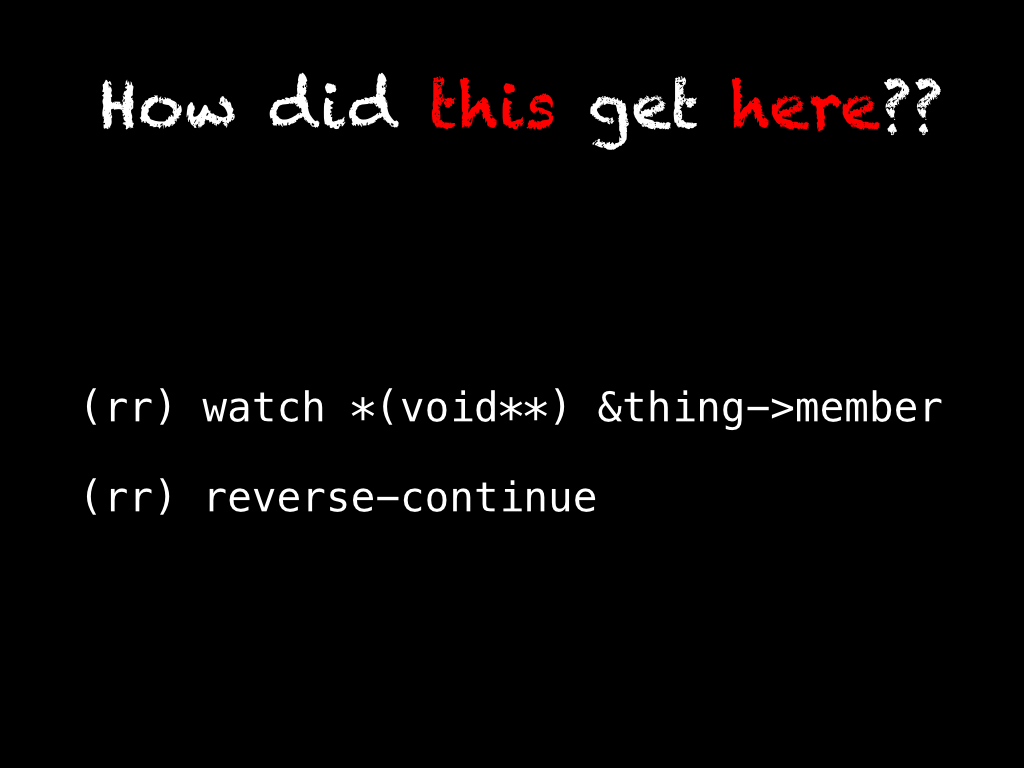
This is the Holy Grail of debuggers. If you could most directly translate "reasoning backwards through the cause and effect chain" into a debugger command, it would be this. When a value has become corrupted, or an instance's member has an unexpected value, we can set a hardware watchpoint on the value or member and then reverse continue directly to the last point in the program's execution when the given value was modified.
This also works with breakpoints and conditional breakpoints in addition to watchpoints.
A few months ago, I was doing a little refactoring of the way that
SpiderMonkey's Debugger API objects interact with the garbage
collector. When SpiderMonkey finishes its final shutdown GC, it asserts that
every Debugger API object has been reclaimed. Somehow, my changes broke that
invariant. I couldn't use the memory tools we have been building to help find
retainers because this was the middle of shutdown and those APIs weren't
designed with that constraint. Additionally,
the core marking loop of the GC is very, very hot and is implemented as a bunch of gotos.
Using a traditional debugger and setting a conditional breakpoint for when my
"leaking" Debugger API object was processed in the marking loop was useless;
it gave no clue as to why it was being marked or who was retaining it and
why they were retained in turn. Using rr, I did set a conditional breakpoint
for when my Debugger API object was pushed on the "to-mark" stack, but then I
reverse stepped to find what object was being marked and queueing my Debugger
API object for marking in turn. Using the combination of conditional breakpoints
and rr's reverse execution, I was able to walk the retaining path backwards
through the GC's marking loop to figure out why my Debugger API object was
sticking around and not getting reclaimed. It turned out that my refactoring
marked a global's Debugger API objects unconditionally, when they should only
be marked if the global was still live.
Thanks for bearing with me! I hope some of my excitement for rr has been
transferred to you. I definitely feel like I can debug more challenging problems
than I otherwise would be able to.
Go forth and use rr! Happy debugging!
That was everything I presented to the Linux Users Group, but since I gave that
presentation I've accumulated one more good rr debugging anecdote:
We (the devtools team) use a series of protobuf messages to serialize and deserialize heap snapshots to and from core dump files. While we are only just building a frontend to this functionality in the devtools, the APIs for saving and reading heap snapshots have existed for a while and have pretty good test coverage. In the process of testing out the new frontend we would seemingly randomly get errors originating from within the protobuf library when reading heap snapshots.
I don't know the protobuf internals, it's a black box to me and on top of that
a lot of it is machine generated by the protoc compiler. But, I rebooted into
Fedora, fired up rr and reproduced the bug. Starting from where the protobuf
message parsing API was returning false to denote a parse failure (no kind of
message or error code explaining why message parsing failed) I started
stepping backwards. It quickly became apparent that I was repeatedly stepping
backwards through frames belonging to the same handful of mutually recursive
functions (clue #1) that were unwinding the stack and returning false along
the way. So I set a breakpoint on the return false; statements I was
repeatedly stepping through and then used gdb's breakpoint commands
to help automate my debugging process.
(rr) commands <breakpoint number>
Type commands for when breakpoint <breakpoint number> is hit, one per line.
End with a line saying just "end".
>reverse-finish
>end
(rr)
After I added this command to each breakpoint, I kicked the process off with a
single reverse-finish which triggered a cascading series of breakpoint hits
followed by another reverse-finish from the automated breakpoint commands. In
a few seconds, I re-wound a couple hundred mutually recursive stack
frames. I ended up on this line within the protobuf library:
if (!input->IncrementRecursionDepth()) return false;It turns out that the protobuf library protects against malicious, deeply
nested messages from blowing the stack by implementing a recursion limit for how
deep messages can nest. Thanks! (Although, I still wish it gave some indication
of why it was failing…) Our core dump protobuf message format was designed
so that we use a lot of individual messages rather than one big nested
structure, but there was one case where we were hitting the limit and that led
to this bug. Luckily, it was pretty easy to fix. I can only
imagine how hard it would have been to debug this without rr!
